Plot the directed acyclic graph (DAG) for causal mediation analysis.
cmdag(
  outcome = NULL,
  exposure = NULL,
  mediator = NULL,
  basec = NULL,
  postc = NULL,
  x.outcome = 4,
  x.exposure = 0,
  x.mediator = 2,
  x.basec = 2,
  x.postc = 2,
  y.outcome = 0,
  y.exposure = 0,
  y.mediator = 1,
  y.basec = 2,
  y.postc = -0.5,
  caption.width = 50,
  caption.size = 10,
  ...
)
Arguments
- outcome
the variable name of the outcome
- exposure
the variable name of the exposure
- mediator
a vector of variable name(s) of the mediator(s)
- basec
(optional) a vector of variable name(s) of the exposure-outcome confounder(s), exposure-mediator confounder(s) and mediator-outcome confounder(s) not affected by the exposure
- postc
(optional) a vector of variable name(s) of the mediator-outcome confounder(s) affected by the exposure
- x.outcome
x coordinate of
outcome. Default is4.- x.exposure
x coordinate of
exposure. Default is0.- x.mediator
x coordinate of
mediator. Default is2.- x.basec
x coordinate of
basec. Default is2.- x.postc
x coordinate of
postc. Default is2.- y.outcome
y coordinate of
outcome. Default is0.- y.exposure
y coordinate of
exposure. Default is0.- y.mediator
y coordinate of
mediator. Default is1.- y.basec
y coordinate of
basec. Default is2.- y.postc
y coordinate of
postc. Default is-0.5.- caption.width
line width in characters for the caption. Default is
50.- caption.size
text size in pts for the caption. Default is
10.- ...
additional arguments passed to
ggdag(). See ggdag for details.
Examples
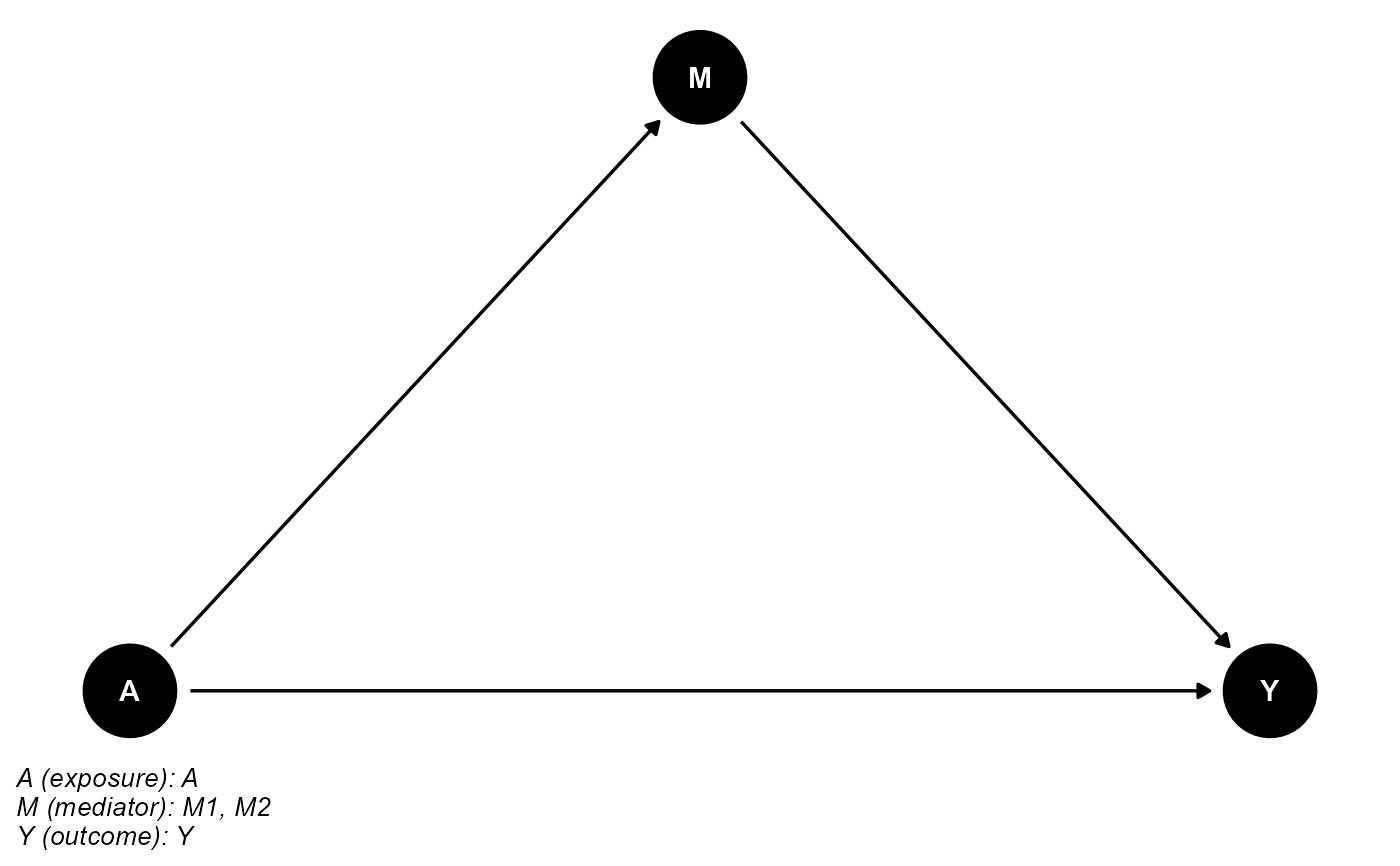
## basec and postc are empty
cmdag(outcome = "Y", exposure = "A", mediator = c("M1", "M2"),
basec = NULL, postc = NULL, node = TRUE, text_col = "white")
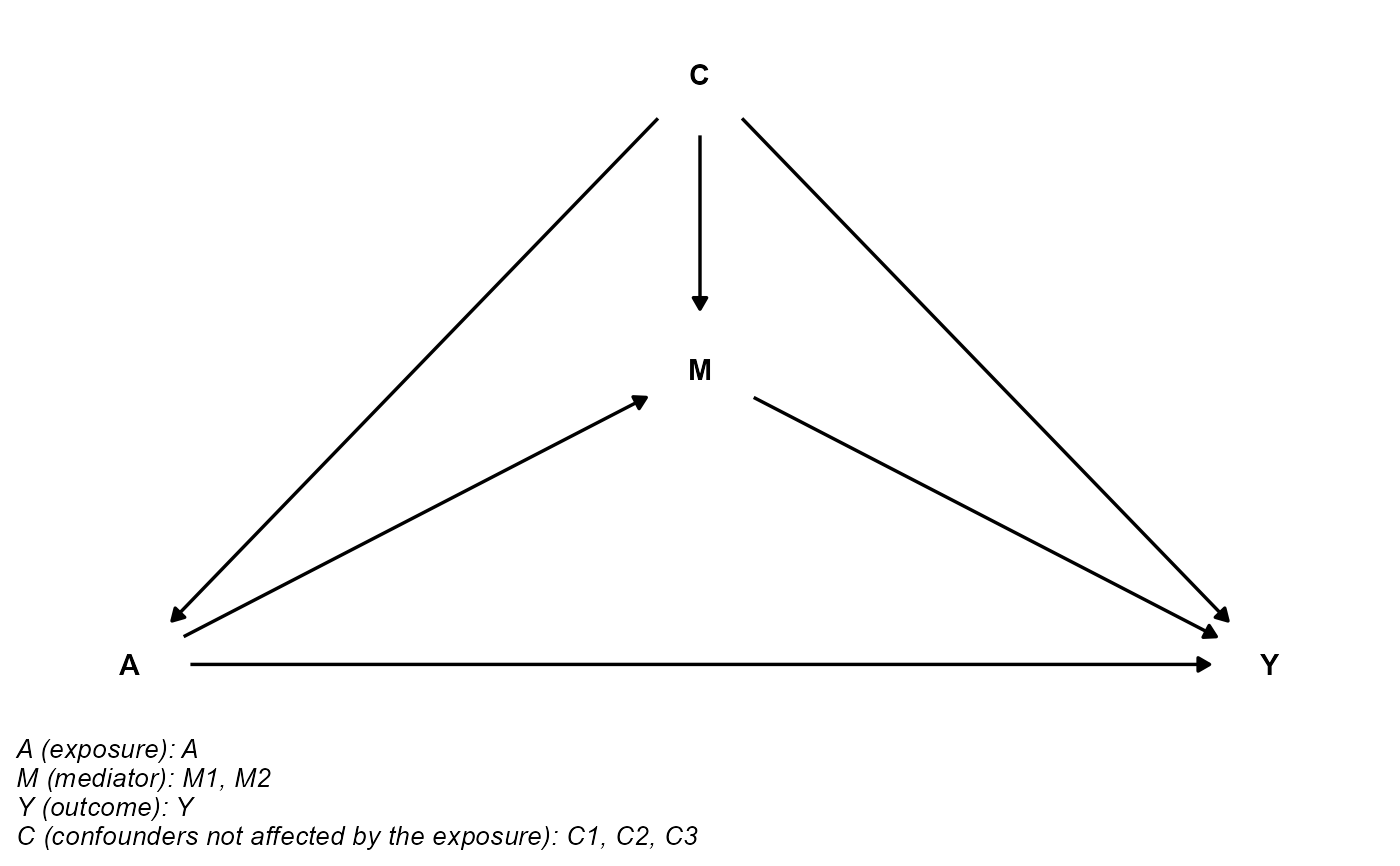
 ## postc is empty
cmdag(outcome = "Y", exposure = "A", mediator = c("M1", "M2"),
basec = c("C1", "C2", "C3"), postc = NULL, node = FALSE, text_col = "black")
## postc is empty
cmdag(outcome = "Y", exposure = "A", mediator = c("M1", "M2"),
basec = c("C1", "C2", "C3"), postc = NULL, node = FALSE, text_col = "black")
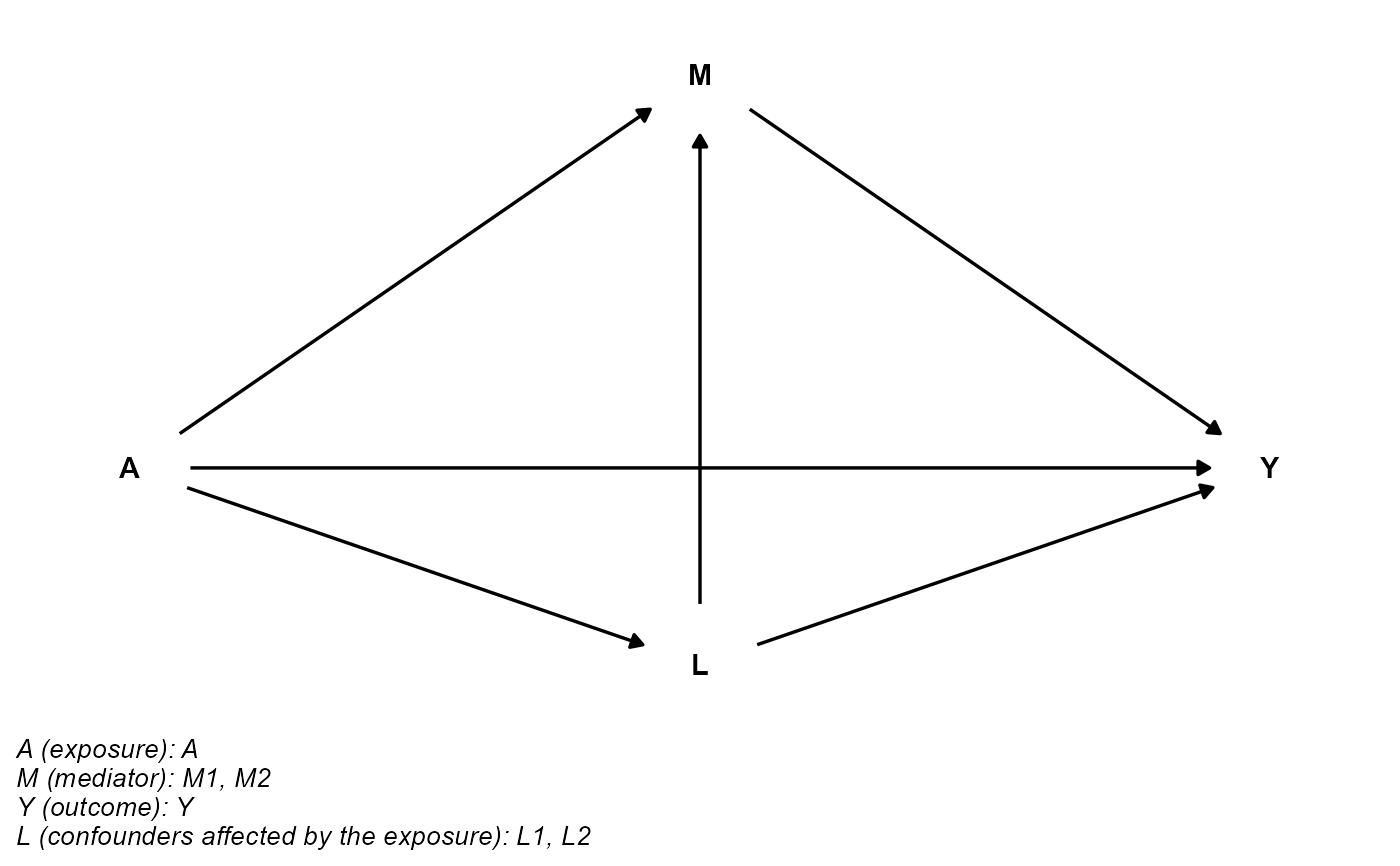
 ## basec is empty
cmdag(outcome = "Y", exposure = "A", mediator = c("M1", "M2"),
basec = NULL, postc = c("L1", "L2"), node = FALSE, text_col = "black")
## basec is empty
cmdag(outcome = "Y", exposure = "A", mediator = c("M1", "M2"),
basec = NULL, postc = c("L1", "L2"), node = FALSE, text_col = "black")
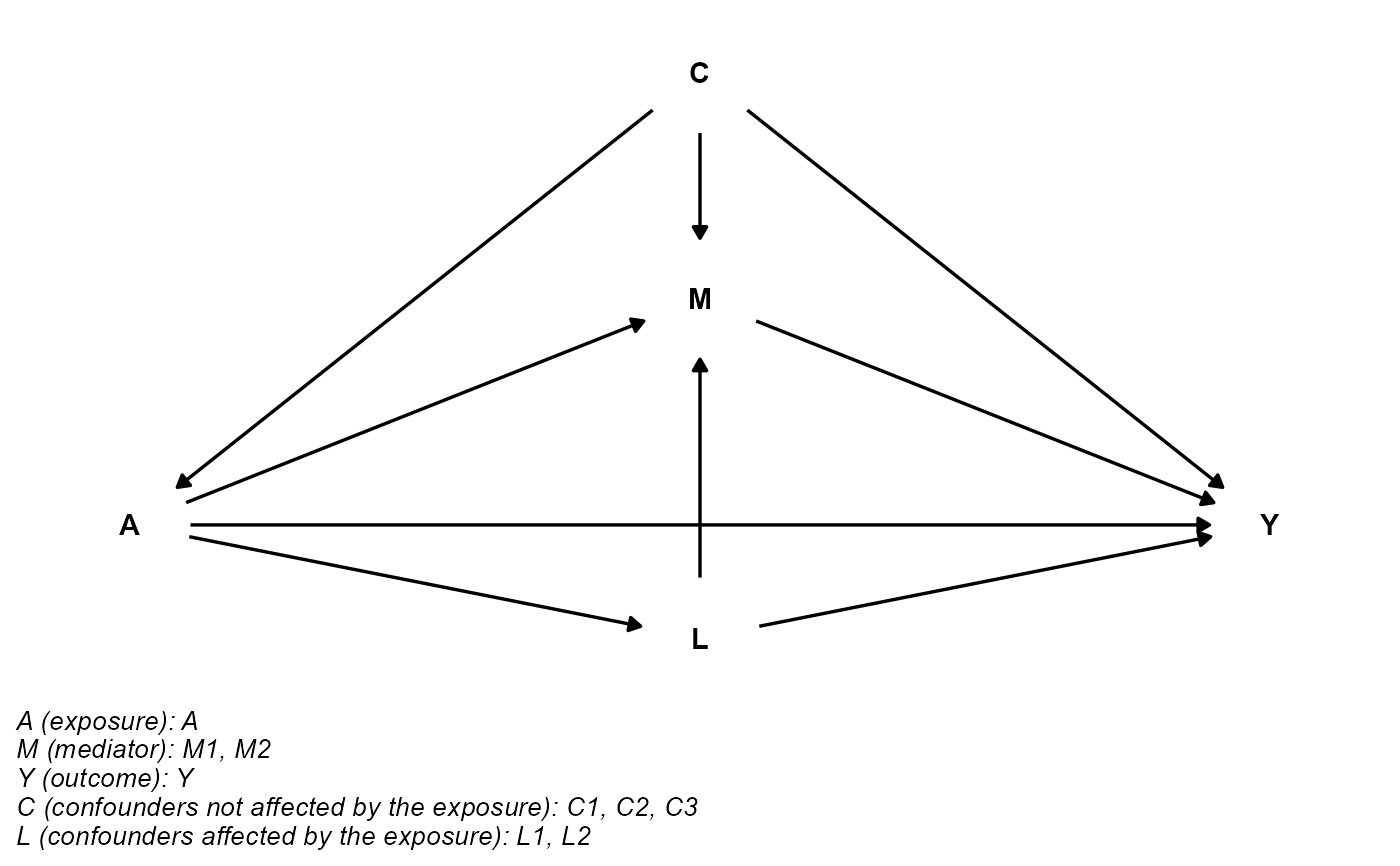
 ## basec and postc aren't empty
cmdag(outcome = "Y", exposure = "A", mediator = c("M1", "M2"),
basec = c("C1", "C2", "C3"), postc = c("L1", "L2"), node = FALSE, text_col = "black")
## basec and postc aren't empty
cmdag(outcome = "Y", exposure = "A", mediator = c("M1", "M2"),
basec = c("C1", "C2", "C3"), postc = c("L1", "L2"), node = FALSE, text_col = "black")