ggcmest is used to plot results of cmest nicely with plotting functions
in the ggplot2 package. Additional layers can be added to this plot using other
plotting functions in the ggplot2 package.
ggcmest(
  x,
  errorbar.width = 0.3,
  errorbar.size = 0.3,
  errorbar.colour = "black",
  point.size = 1,
  point.colour = "blue",
  refline = TRUE,
  refline.colour = "red",
  refline.size = 0.3
)
Arguments
- x
an object of class
cmest- errorbar.width
width of errorbars for confidence intervals. Default is
0.3.- errorbar.size
size of errorbars for confidence intervals. Default is
0.3.- errorbar.colour
colour of errorbars for confidence intervals. Default is
black.- point.size
size of points for point estimates. Default is
1.- point.colour
colour of points for point estimates. Default is
blue.- refline
a logical value. If
true, include a reference line aty = 0when effects are on the difference scale and include a reference line aty = 1when effects are on the ratio scale. Default isTRUE.- refline.colour
colour of the reference line. Default is
red.- refline.size
size of the reference line. Default is
0.3.
Examples
library(CMAverse)
library(ggplot2)
#> Warning: package 'ggplot2' was built under R version 4.5.2
x <- cmest(data = cma2020, model = "rb", outcome = "contY",
exposure = "A", mediator = "M2", basec = c("C1", "C2"),
EMint = TRUE, mreg = list("multinomial"), yreg = "linear",
astar = 0, a = 1, mval = list("M2_0"), estimation = "paramfunc",
inference = "delta")
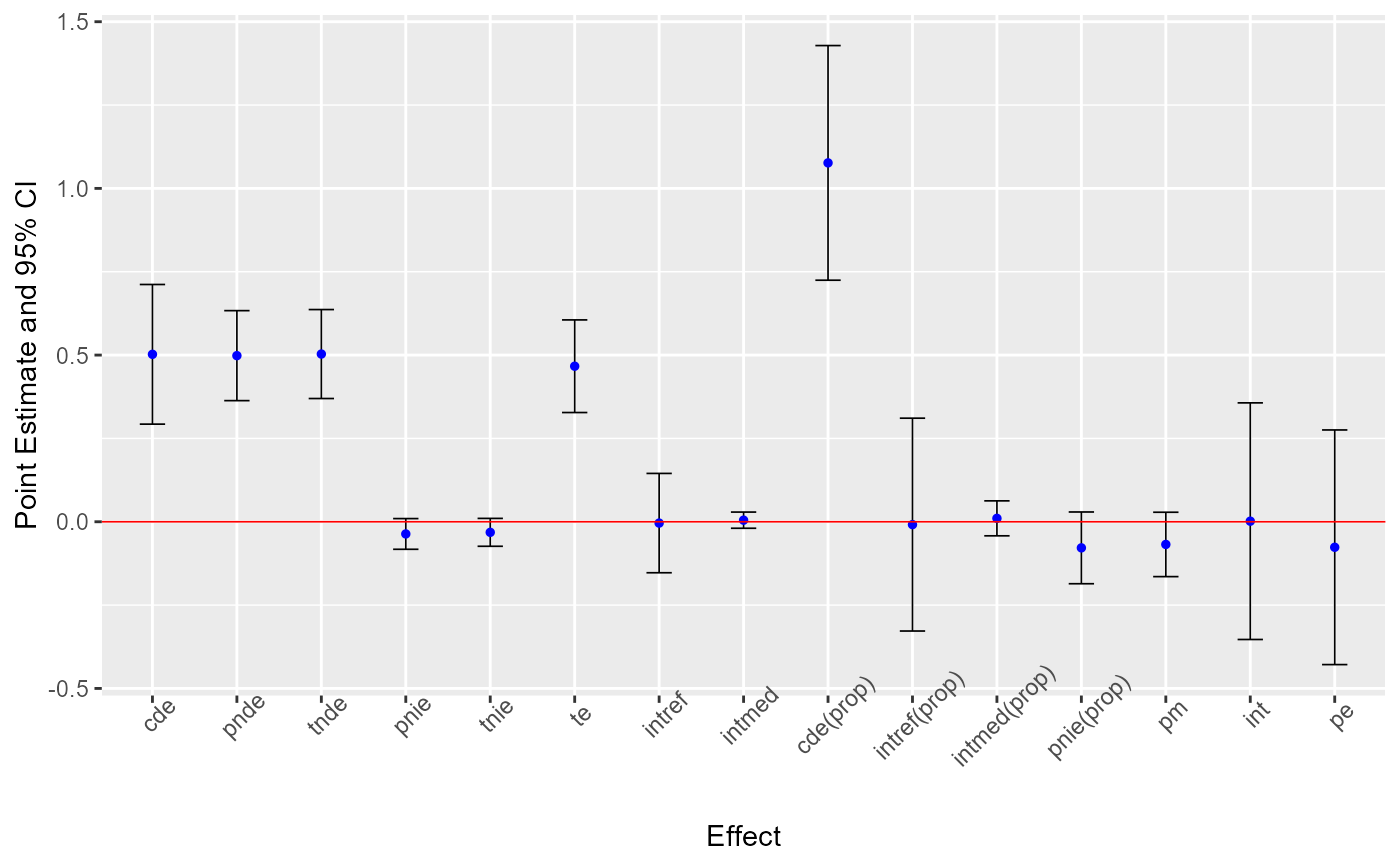
ggcmest(x) +
theme(axis.text.x = element_text(angle = 45))
#> Warning: Using `size` aesthetic for lines was deprecated in ggplot2 3.4.0.
#> ℹ Please use `linewidth` instead.
#> ℹ The deprecated feature was likely used in the CMAverse package.
#> Please report the issue at <https://github.com/XiaoniXu/CMAverse/issues>.
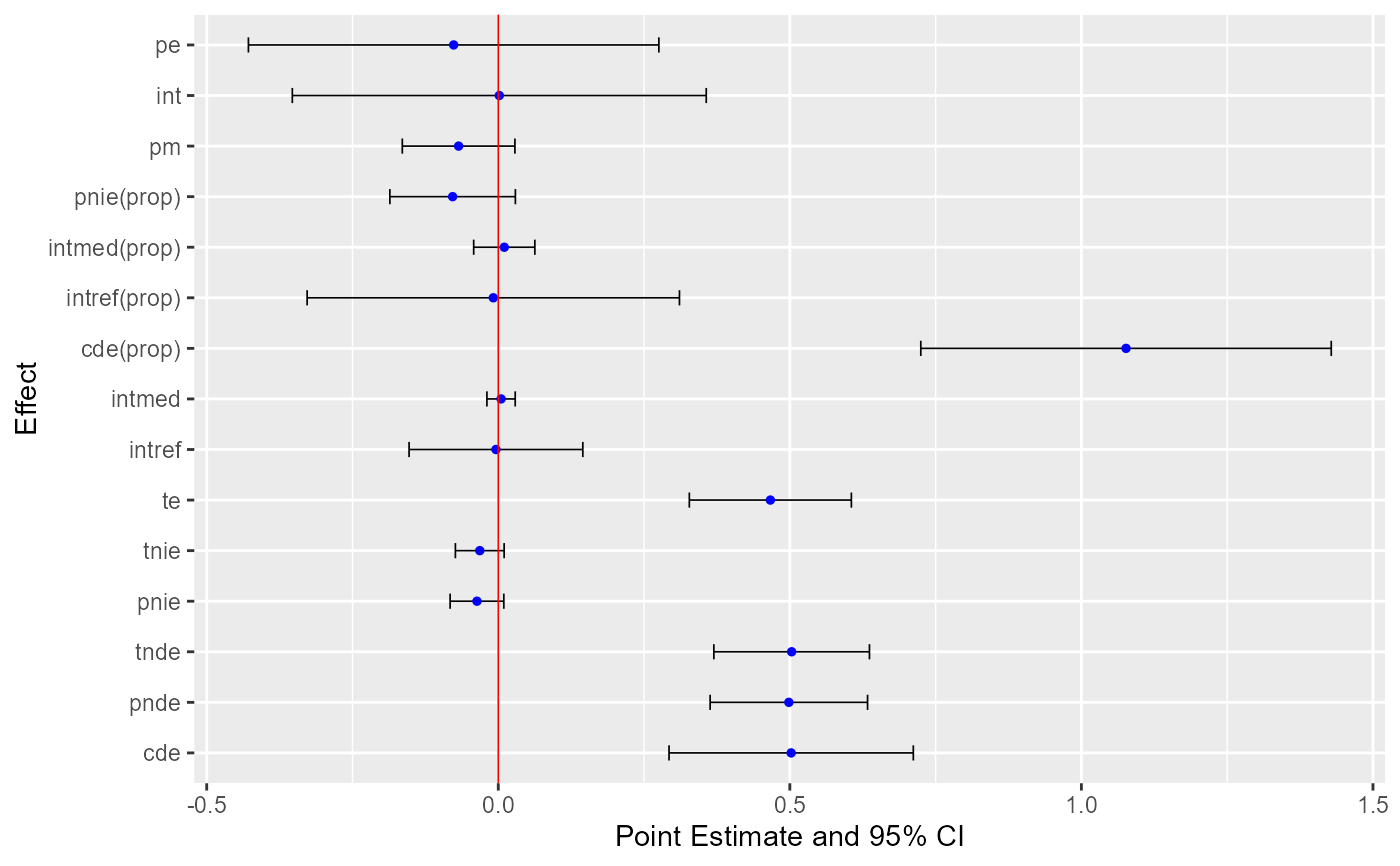
 ggcmest(x) +
coord_flip(xlim = NULL, ylim = NULL, expand = TRUE, clip = "on")
ggcmest(x) +
coord_flip(xlim = NULL, ylim = NULL, expand = TRUE, clip = "on")